The DIADEM Metric
The metric executable and code is made available and its usage described on the Metric Readme page. A glossary of terms is also available. If you use the metric, please cite:
Gillette, T. A., Brown, K. M., & Ascoli, G. A. (2011). The DIADEM metric: comparing multiple reconstructions of the same neuron. Neuroinformatics, 9(2-3): 233-245.
The DIADEM metric compares, on the basis of topology, two digital morphological reconstructions of one and the same neuron. The two reconstructions are both spatially registered to the same image stack and thus to each other. The metric is a multi-step process that scores the connection between each node in the gold standard (for example, manual) reconstruction based on whether or not the test (for example, automated) reconstruction captures that connection. Moreover, the importance of a connection may be taken into account to reflect the global topological similarity of the trees. This is done by weighting each connection by a chosen node attribute. In the case of global topology, the weight would be the size of the subtree to which a connection leads in terms of terminal degree. Finally, an option exists for considering excess nodes in the test reconstruction that are not present in the gold standard to lower the score. Special processes exist for specific data sets as described in the individual data set README files.
Below is a basic step-by-step explanation of the general scoring process for a given node (bifurcation or termination), referred to as the target node, in the gold standard tree:
1. All nodes in the test tree that are within a given Euclidean distance threshold of the target node, regardless of node type (i.e. bifurcation or termination, but see note at end on an alternative for terminations), are matches (or are said to match). The specific mechanism of the distance threshold involves separate checks for XY distance and Z distance given the different resolutions. One could imagine a cylinder as the threshold region, with the base in the XY plane and the height spanning the Z dimension (Fig. 1).
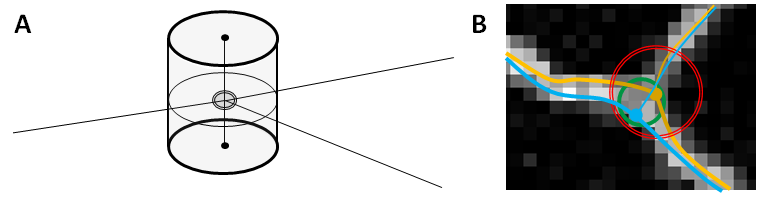
Figure 1: A) Threshold region in 3D. The double-ringed central circle intersected by the branches (lines) is the bifurcation node. The cylinder represents the threshold region, within which potential matches may be located. The cylinder is generated from expanding the XY threshold circle to the bounds of the Z threshold. B) A trace could validly place the bifurcation anywhere within the specified region (green ring). Since the gold standard trace might have the bifurcation at the edge (gold trace), and since as far as the metric is aware the actual neurite could be centered in any direction, the threshold region (double red ring) will have a radius twice that of the valid region's radius. Thus a test trace (blue) that bifurcates at the opposite edge will still be matched.
2. Each test match to the target node is then checked for proper connectivity based on the path from the target node to an ancestor (a node on the direct path to the root) that matches an ancestor of the target node. The lengths of the gold standard and test paths are used to confirm the matches. The process is explained in more detail:
2A. Both gold standard and test trees are "climbed" (from the target and its match respectively) until a test ancestor is within threshold of a gold standard ancestor (Fig. 2). The roots of the gold standard and test trees are co-registered and thus constitute matches. The target node and its given match are confirmed if the differences in path length between target node and ancestor, and between match node and its matched ancestor, are within a defined path length error threshold. Specifically, the XY component of the test path length (LTxy) is subtracted from that of the gold standard path length (LGxy) to derive the XY path length error. In order to account for difference in position of the nodes at each endpoint of the path, the test path length is adjusted (Fig. 3). The remaining amount is divided by the total gold standard path length (LG) to derive an XY error rate.
The same process is also used for determining the Z error rate. If the rates are less than the path length error thresholds (whereby there is a threshold for XY and a threshold for Z), then the match is a confirmed match.
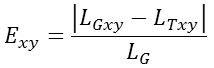
Figure 2: Establishing branch connectivity with an ancestor. The target node of the gold standard reconstruction (double green ring) has a candidate test node in both test trees to the right. The red X symbols are the ancestors of the target node that have no match in Test Tree A, and the ancestors of the potential match in Test Tree A that have no match in the gold standard. However the ancestor with the thin green ring matches spatially and in terms of the paths between ancestor and target, resulting in a match for Test Tree A. Test Tree B has an ancestor in the right location, but the length of the path between it and the target node is incorrect (dashed yellow ring), resulting in a miss for Test Tree B.
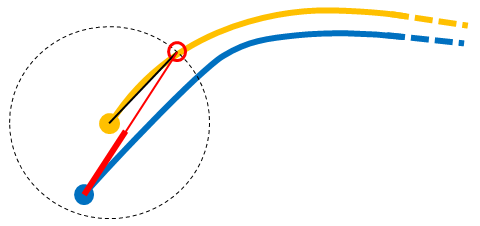
Figure 3: Test path length adjustment. The test node (blue dot) is within the target node’s threshold region (dashed ring), but is not at the same point as the target node (gold dot). The gold standard path leaves the threshold region at the "trajectory point" (red ring). The test path length is shortened by the distance of the thick red line, which is the test node’s distance from the trajectory point minus the target node’s distance from the trajectory point.
2B. It is possible for there to be more than one confirmed match to the target node based on the previous criteria. In this case, the connectivity to descendants (nodes on the path to a termination) is checked. Descendants of the target node are traversed in a breadth-first order (i.e. in order by branch order) and matches to a descendant are tested for their connectivity. That is, if a matching descendant has an ancestor that is one of the confirmed matches (and its path length also matches), then descendant connectivity is confirmed and the associated confirmed match is set as the selected match. If there are multiple confirmed matches that have confirmed descendant connectivity, or if none of the confirmed matches have confirmed descendant connectivity, the closest remaining confirmed match is the selected match.
2C. Any test node that is a selected match is registered to its associated gold standard node, making it no longer available for matching to subsequent target nodes.
3. Terminal nodes without a match are marked as misses. If a node match is not found for a target bifurcation, the following process is used to look for potential continuation matches after all gold standard nodes have already been checked for direct matches (Fig. 4).
3A. The gold standard tree is climbed from the target node until an ancestor is found with a test node within the distance threshold.
3B. The gold standard tree is traversed downwards from the target node until a descendant node is within threshold distance of a test node (yellow nodes in Fig. 4).
3C. If the path length errors (as described in step 2A) are less than the path length error thresholds then the target node is a continuation, counting equivalently as a selected match.
3D. If the path distances do not match then step 3B is repeated until a match is found or all descendants have been searched. Along any given topological path from the gold standard node, the search along that path ends when a node with a selected match is found. Only one ancestor path exists, but any number of descendant paths may exist.
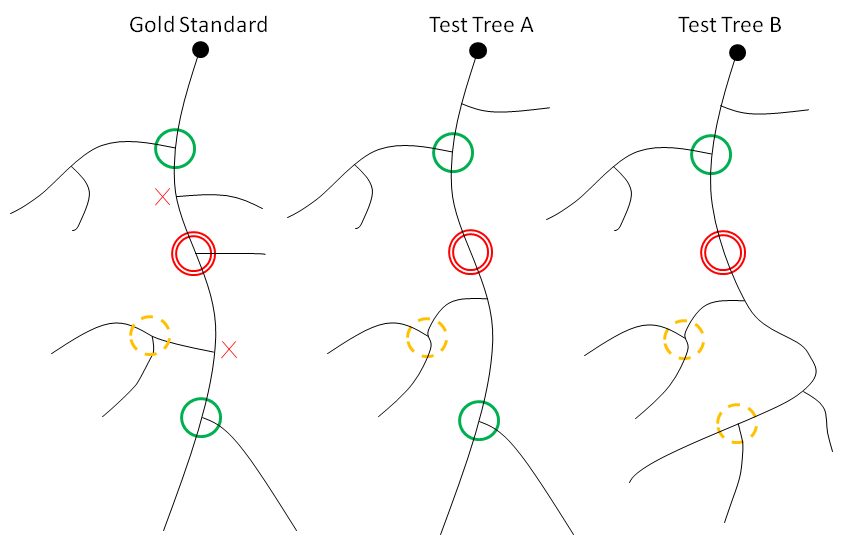
Figure 4: Continuation search. Symbols on the gold standard correspond with symbols on Test Tree A, which has a confirmed continuation for the target node (double red ring). Test Tree B results in a miss for the target node. The target node has no matching node in either test tree. The red X marks show an ancestor and descendant without matches in either test tree. Both test trees do contain a matching ancestor (green ring above target). On the gold standard tree, the dashed yellow ring identifies a possible descendant match, however the paths do not match and so the descendant is rejected. The second descendant’s position (green ring below target) and path to the ancestor do match, confirming the continuation for Test Tree A. Descendants in Test Tree B match only by position. Thus Test Tree B does not confirm a continuation, and the target node is missed.
4. By default the weight of the target node is its degree (i.e. the number of terminations to which the node leads). Other options are available.
5. Terminal test nodes that do not match any node in the gold standard tree are excess nodes (Fig. 5), counted as misses with weight 1. A terminal test node is not an excess node if there is a gold standard node within threshold distance of the terminal test node (Fig. 5A) or it has a matching parent (Fig. 5B). Non-matching bifurcation test nodes are checked for potential continuation matches (see step 3 above), and counted as misses if not found to be a continuation. Their weight is the number of excess terminal descendants with no matching nodes in between. Thus a non-matched test node will not count against the score if its children are matched or not counted as excess nodes.
Figure 5: Determining excess nodes. A) The gold terminal node is a miss due to its incorrect path. The blue test termination is not an excess node since there is a gold standard node within threshold distance. Since the termination will not count as an excess node, the parent bifurcation does not count against the score either. B) The gold terminal node misses due to the incorrect test terminal’s position. The blue test termination is not an excess node since its parent bifurcation is matched. C) The blue test termination has no basis in the gold standard reconstruction and so it is an excess node.
Once all gold standard nodes have been processed and excess nodes are determined, a grand score is calculated that describes how well the test reconstruction matches the gold standard in terms of global topology. Each node in the gold standard reconstruction that was matched or determined to have a continuation in the test reconstruction has its weight added to the numerator of the grand total. All nodes in the gold standard reconstruction and all excess nodes have their weights added to the denominator. Moreover, nodes are not differentiated by tree or data file. If multiple files (i.e. multiple gold standard and test files) are analyzed in a single run of the metric, all nodes will be included in the grand score based on their individual weights. This produces a score between 0 and 1 that reflects topological similarity, with a score of 1 reflecting a perfect score. Given the way continuations and excess nodes are treated, the metric is asymmetric in that a different score may be produced depending on which tree(s) is entered as the gold standard and which as the test reconstruction(s).
Note: An alternative method is available that allows terminal nodes to be matched even if their branches are longer or shorter than the target branch. This method is similar to that used for Neuromuscular Projection rosettes, using path points from the SWC file to determine whether the longer branch's path does come within standard threshold distance of the shorter branch's terminal location. See the Metric Readme Additional Parameters section for a description of the parameters necessary to execute the alternative method ("terminal-threshold" and "terminal-path-threshold"). As of the most recent update this method has not been exhaustively tested.